Understanding your booking frequency can unlock major profit and growth for your short-term rental business. We’ll cover the essentials of measuring and improving your occupancy performance, including:
- The real meaning of ‘occupancy rate’, and how to calculate it
- The average Airbnb occupancy rate in the U.S
- Why national averages don’t tell the full story
- Factors that impact occupancy at the local level
- Refining your strategy based on seasonality, amenities, and pricing
Determining your occupancy rate
Your occupancy rate shows the percentage of time your property is booked out of its total available nights.
Formula:
(Nights booked ÷ Nights available) × 100 = Occupancy rate
For example, if a listing is available for 300 nights a year and booked for 180, your occupancy rate is 60%.
This metric helps you gauge the consistency of income generated by your rentals. However, a high occupancy rate doesn’t always translate to higher revenue – pricing plays a crucial role too. For instance, booking 90% of your calendar at extremely low rates could produce lower profits than booking 60% at optimal pricing.
Average Airbnb occupancy rates in the U.S.
According to industry data, the average Airbnb occupancy rate in the U.S. stands at 50% as of spring 2025. However, national numbers merely serve as a rough benchmark and mask wide variability across states, cities, and neighborhoods.
- Hawaiian markets, Maui and Oahu, have shown occupancy rates approaching 70%, especially in peak season.
- Occupancy tends to be more consistent year-round in urban areas but rarely exceeds 70%.
- Rural or oversaturated markets may struggle to reach 40% occupancy.
Even within large cities like Atlanta, some neighborhoods perform far below the national average, while others have exceeded 60%.

How seasonality impacts Airbnb occupancy rates
Hosts should expect seasonal booking fluctuations, with winter typically considered ‘low season’ in most markets. Decreased off-season occupancy is less a reflection of listing quality, but rather presents predictable market cycles that affect the entire industry.
In the U.S., we see the lowest average occupancy in January across most markets (around 41.6%), and the highest national average in July (~67.5%). In Florida, occupancy can peak at 84% in March and drop drastically by October.
Understanding seasonal booking trends allows you to mitigate expected occupancy drops and turn them into an advantage. Traditionally slow periods can be leveraged by implementing dynamic pricing strategies, offering more flexible minimum stay requirements, or targeting specialized markets such as remote workers or digital nomads.
Airbnb occupancy rates by ZIP code and neighborhood
City-wide data can offer a broad overview, but is rarely useful for strategic decision-making. For example, Los Angeles has an average occupancy rate of around 60%, despite Cypress Park’s 79% occupancy or the oscillation of rates in downtown LA, which hits far below average off-season. Each neighborhood attracts a distinct guest profile and operates under a unique price-to-demand ratio.
It’s highly recommended to delve into submarket-level data before setting revenue goals. You can leverage ZIP code-level trends from specialized short-term rental analytics platforms to gain crucial market insights on growing areas, changing seasonal demand by neighborhood, and occupancy benchmarks for similar properties.
Factors that influence Airbnb occupancy rates
Several key factors determine how many nights your property gets booked:
1. Property type and size
Smaller units like studios and one-bedroom apartments tend to perform better in urban settings, especially for business or solo travelers, while spacious homes might book fewer nights but yield higher revenue per reservation.
2. Your pricing strategy
Budget listings show higher average occupancy, while high-end properties often fall below average occupancy while still yielding high revenue. It’s wise to avoid extreme pricing, as underpricing may lead to unsustainable cleaning and maintenance costs, while overpricing can limit visibility and bookings.
3. Amenity selection
Amenity choices can significantly impact your occupancy across different guest segments. For example, Wi-Fi and a dedicated workspace are essential for remote workers, while vacationers find properties with hot tubs, spacious patios, and grills more attractive.
4. Listing presentation and responsiveness
The way you present your listings directly influences booking decisions. High-resolution, professionally staged photos and clear, benefit-driven descriptions can significantly boost interest.
Your approach to communication is equally important, as rapid responses to initial inquiries not only cut general abandonment rates but also improve your property ranking on Airbnb and invite exceptional reviews, further boosting your visibility for the next guest cycle.
5. Stay policies and booking settings
In competitive markets, enabling Instant Book availability and offering shorter minimum stays correlates strongly with higher occupancy rates by reducing friction in the booking process and accommodating spontaneous travelers. Overly restrictive policies, especially during slower periods, can drastically reduce your booking volume.
Why there’s no one “good” occupancy rate
A “good” occupancy rate isn’t universal. Rather, it depends on your market and your strategy. A property in a year-round destination like San Diego will operate healthily with a 60% occupancy, while a high-end mountain cabin may thrive at 40%, thanks to premium nightly rates.
High occupancy only tells part of the story. Tracking RevPAR — which combines occupancy and nightly rates — provides a more precise view of your rental’s financial performance. If you’re consistently booked above 75% and not raising prices, you may be leaving money on the table. If you’re below 40%, you may want to review your photos, pricing, and guest communication strategy.

How to analyze and improve your Airbnb occupancy rate
Improving your occupancy rate starts with understanding your current performance. Not just through raw booking numbers, but by evaluating patterns, trends, and missed opportunities. With the right tools and data, you can build a clear strategy for boosting bookings and maximizing revenue.
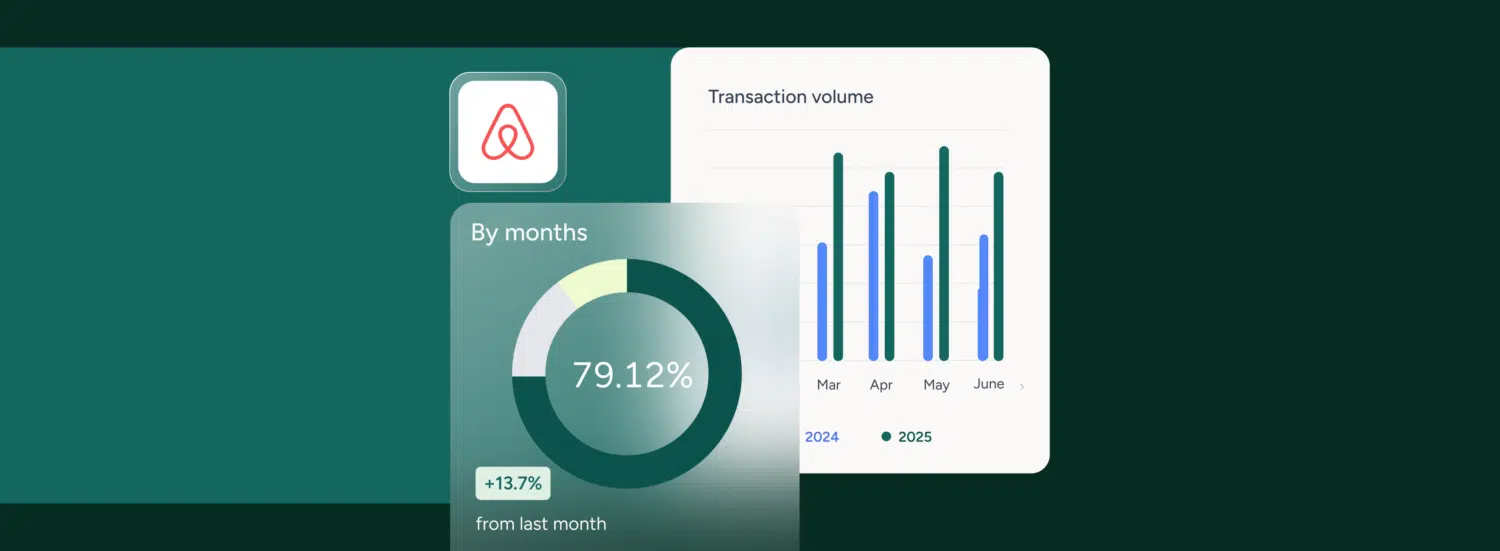
Tracking your occupancy rate using Airbnb insights
If you’re using Airbnb’s professional hosting tools, you can track your occupancy rate directly through the Performance dashboard:
- Go to your hosting dashboard
- Select “Performance” > “Occupancy & Rates”
- View your average occupancy rate, booking trends, and how they change over time
You’ll also see related metrics such as total booked nights, average length of stay, and gaps in your calendar that may affect revenue. For newer hosts or those expanding into new markets, this data is foundational for understanding how your listing performs compared to market benchmarks.
Here’s a step-by-step guide on how to list on Airbnb if you’re just starting out.
Why booking rates and occupancy rates aren’t the same
It’s common to confuse occupancy rate with booking rate, but they measure different things. Your occupancy rate equals the number of nights booked out of the total nights available. Your booking rate equals the number of listing views that result in a confirmed booking.
A high occupancy rate with a low booking rate might mean your calendar is filled, but you’re underpricing. A high booking rate with low occupancy could indicate strong demand, but limited availability or missed opportunities to expand.
Both metrics should be monitored to balance availability, visibility, and profitability.
Leverage advanced property analytics
To move beyond basic metrics and make smarter, data-driven decisions, it’s worth using an end-to-end analytics platform designed specifically for the vacation rental industry.
Guesty Analytics offers integrated tools that help you:
- Track occupancy, revenue, and booking trends across multiple listings
- Benchmark listings against market data to refine your pricing
- Analyze historical performance and demand shifts
- Identify operational bottlenecks like delayed responses or unbalanced team workload
- Improve guest experience by tracking communication quality and review trends
From revenue mapping to task performance, a centralized dashboard helps hosts and property managers optimize operations at every level.
Why your Airbnb occupancy rate is low and how to fix it
Weekday gaps:
Many hosts see consistent weekend bookings, but struggle midweek. Learn how to increase weekday reservations by targeting digital nomads or offering incentives for longer stays.
Uncompetitive pricing:
Use competitive benchmarking tools to stay aligned with local ADR trends. Align prices with local demand using real-time market comparisons.
Poor listing optimization:
- Update your title and description regularly
- Add relevant amenities and keywords for better search visibility
- Keep your calendar and availability up-to-date
No Strategic Marketing:
Promote your listing on multiple channels and tailor your approach based on guest types and demand shifts.
Investing in the right market
If you’re still deciding where to invest in a vacation rental, it’s critical to understand market-level occupancy trends. Some cities are far more resilient and profitable than others.
Check out this guide on the Top 10 U.S. cities to invest in a vacation rental property to discover where demand is growing, occupancy is strong, and regulation is favorable.
How to build a long-term strategy for Airbnb growth
When building or scaling a vacation rental business, you’ll need more than a single listing strategy–you need operations, marketing, and analytics working in sync. Use this step-by-step business guide to learn how to build a solid foundation, from choosing the right market and acquiring property, to automating guest communication and scaling for long-term, sustainable success.
Understanding and optimizing your occupancy rate isn’t just about boosting bookings — it’s about creating a smarter, more profitable short-term rental business. With tools like Guesty Analytics and insights from your market and your listings, you can make confident, strategic decisions that increase your revenue and guest satisfaction.

Seasoned content writer with a passion for media, the written word, and crafting compelling narratives that educate, build trust, and deliver lasting value.